Choosing Cylindrical Solar PV Modules starts with a practical question: where will each module sit, and what will it power? Their curved form can suit poles, canopies, and other surfaces that flat panels cannot cover easily. But shape alone does not guarantee higher output. Check rated power, tested efficiency, shading behavior, and mounting requirements. Small details matter. Real-world performance can differ from a neat product image.
IRENA’s Renewable Capacity Statistics 2025 reports that global solar capacity reached about 1,865 GW by the end of 2024, following roughly 452 GW of additions that year. That growth signals a fast-moving market, not proof that cylindrical designs outperform conventional panels. The data does not isolate cylindrical modules. That distinction matters. Fatih Birol, Executive Director of the International Energy Agency, described solar’s wider momentum: “Solar is the new king of electricity markets in many countries, based on the current policy settings.” His comment provides useful context, not a product endorsement.
For a sound comparison, request independent test results and a datasheet showing performance under defined conditions. Ask how the module handles partial shade, heat, wind, and water exposure at your actual site. Check connector compatibility, inverter limits, warranty coverage, and replacement availability. A sample installation helps. A brochure is not enough. Compare annual energy estimates against a conventional panel on the same surface, using the same assumptions. Some claims may look impressive; they still deserve scrutiny.
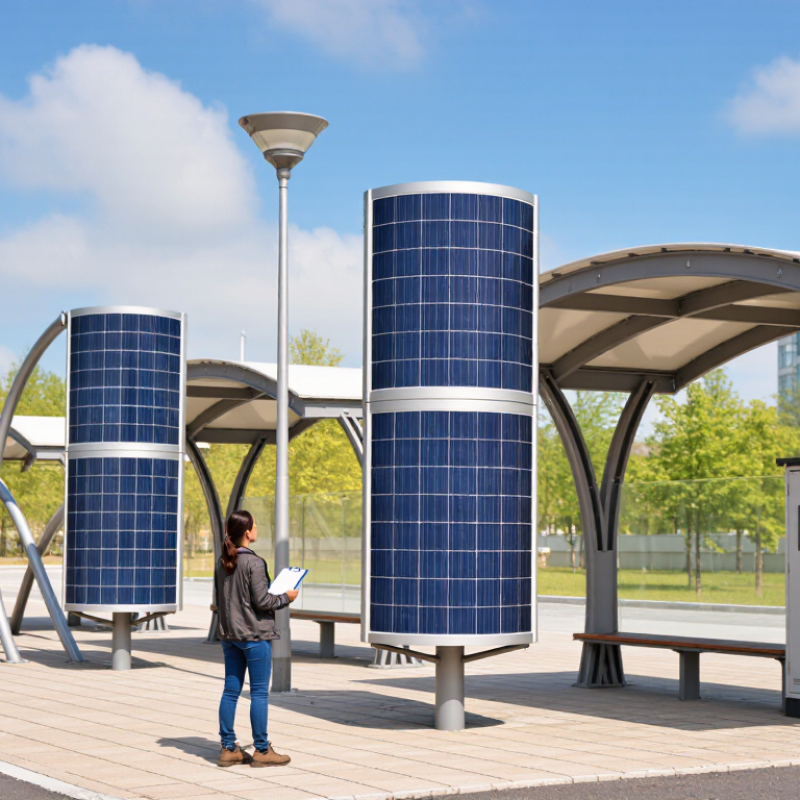
Define Cylindrical PV Geometry and Verify Any 360° Light-Collection Claims
A cylindrical PV module is a curved surface wrapped around an axis; its active area depends on cylinder diameter, length, and the fraction actually covered by cells. For diameter D and length L, the full surface area is πDL. Its projected width toward a fixed sun direction is at most DL, so more surface does not mean proportionally more energy.
Ask whether “360° collection” describes exposed module area, active cell coverage, or measured electrical output. These are not interchangeable.
Sunlight changes angle through the day, while a cylinder may receive direct light on different sides at different times. Shading between modules, wiring, and inactive seams also reduce usable output. IEA PVPS Task 13’s 2021 review of bifacial systems reports energy gains commonly in the 5–20% range, depending on albedo and installation; that is not a guaranteed cylindrical-module gain. Not automatically.
Request independent, side-by-side test data with site, season, mounting spacing, and reference-module details. Compare energy per installed watt over a full year, not a brief midday reading.
NREL’s PVWatts documentation likewise bases production estimates on plane-of-array irradiance and system losses. Ask for the measurement method and raw time-series data. A glossy curve is not proof. I would also check whether the test compares equal active cell area; that detail is easy to overlook.
Compare Output at STC: 1,000 W/m², AM1.5, and 25°C
For cylindrical solar PV modules, compare power only under the same Standard Test Conditions: 1,000 W/m² irradiance, an AM1.5 spectrum, and a cell temperature of 25°C. IEC 60904-3 defines the reference solar spectrum used in photovoltaic measurements. Check that each quoted rating uses these conditions, not a bright-day field measurement. Small differences in test setup can distort a close comparison.
Look beyond watts per module. Record rated power and power per square metre, and ask whether area means the curved surface or the module’s projected aperture. That detail matters when comparing cylinders with flat panels. NREL’s PVWatts documentation uses a −0.37%/°C temperature coefficient as a default for crystalline-silicon modules; actual products differ. A module operating 20°C above its rated cell temperature could therefore lose roughly 7.4% of output, as a rough estimate. Real results vary.
Check the test report, not just the sales sheet. Confirm calibrated irradiance, cell temperature, and the measurement method for the cylindrical geometry. Then compare modules under matched conditions. Useful, but not the whole story. Shade, mounting angle, and changing sunlight can alter field output, and a neat STC number cannot capture every installation. I would also ask for repeat-test uncertainty; it is easy to overlook.
How to Choose Cylindrical Solar PV Modules?
Compare calculated output at STC: 1,000 W/m² irradiance, AM1.5 spectrum, and 25°C cell temperature.
Output is calculated as irradiance × assumed module efficiency: 15%, 18%, 20%, and 22% correspond to 150, 180, 200, and 220 W per square metre, respectively. These are illustrative efficiency scenarios, not measured specifications for particular cylindrical modules. Compare products using their verified STC ratings and the same definition of active or aperture area.
Assess Efficiency, Temperature Coefficient, and Annual Energy Yield
When comparing cylindrical solar PV modules, treat rated efficiency as a starting point, not a promise of annual output. Check whether efficiency uses the full outer surface or active aperture area. Curved geometry can distort comparisons with flat panels. Ask for the test conditions and rated power under standard irradiance and temperature. Small details matter. A clean datasheet helps, but it cannot predict your roof.
The temperature coefficient shows how output changes as cell temperature rises above 25°C. A value of −0.30%/°C loses less power in heat than −0.40%/°C, all else equal. At a 25°C rise, those figures imply roughly 7.5% and 10% power reductions. Real modules warm unevenly, and airflow around a cylinder can vary. Treat the calculation as an estimate, not a guarantee.
Annual energy yield is the practical comparison. Estimate kilowatt-hours per year using the same location, mounting, shading, wiring, and inverter assumptions. Include seasonal sun angles and nearby obstructions. Cylindrical surfaces may capture light from changing directions, but any gain depends on installation. Compare yield per module and per available roof area. Ask for the weather data and loss assumptions behind the estimate, then check them against local conditions. Small mounting changes can shift the result more than a datasheet suggests.
Verify IEC 61215 Performance Qualification and IEC 61730 Safety Compliance
When choosing cylindrical solar PV modules, ask for evidence against IEC 61215 and IEC 61730. IEC 61215 evaluates design qualification and performance through tests such as thermal cycling, damp heat, and mechanical loading. It helps assess durability, but it does not predict a module’s exact service life. No test can do that.
Check that the certificate and test report match the precise module model and construction you plan to buy. A change in glass, encapsulant, cell layout, or mounting method can matter. This is especially relevant for curved modules, where installation and load conditions may differ from flat panels. Ask which edition of each standard was applied, and confirm the documents with the issuing certification body. Paperwork deserves scrutiny.
IEC 61730 addresses electrical and fire-related safety, including insulation and construction requirements. Review its documentation alongside the module’s installation instructions, cable details, and connector ratings. On a sample, inspect seals and cable exits for gaps or strain; a tidy appearance alone proves little. If a seller provides only a logo or a broad certificate, request the underlying report. Even then, I would not treat certification as a substitute for checking site-specific wind, mounting, and wiring conditions. I may be overcautious, but those details are easy to miss.
Match Module Voltage to the Inverter’s 1,000 V or 1,500 V DC Limit
Choosing cylindrical solar PV modules starts with the inverter’s maximum DC input voltage, not its AC rating. A 1,000 V inverter and a 1,500 V inverter allow different series-string designs. Stay below the stated ceiling. Always. Use the exact module datasheet, since cylindrical module voltage varies by model.
Module open-circuit voltage, or Voc, rises as cell temperature falls. Use its temperature coefficient and the site’s lowest design temperature to estimate cold-weather Voc. Multiply that adjusted value by the number of modules in series. The result must remain below both the inverter limit and the module’s maximum system voltage. Do not size a string using standard test-condition Voc alone. A mild-day reading may look fine, while a clear winter morning pushes voltage higher.
Check the inverter’s MPPT operating range, input current, and parallel-string limits too. A string can meet the maximum voltage limit yet operate outside the useful tracking range. A 1,500 V rating is not permission to add modules blindly. A spreadsheet helps, but one copied temperature value can quietly spoil the result. Document the calculation and have a qualified designer verify it against equipment manuals and site conditions. Leave headroom rather than designing right at the limit. These checks are small. The consequences aren’t.
How to Choose Cylindrical Solar PV Modules? — Match Module Voltage to the Inverter’s 1,000 V or 1,500 V DC Limit
Calculation: Cold Voc = STC Voc × [1 + (absolute value of the Voc temperature coefficient × (25°C − minimum design temperature))]. The maximum string length is the inverter’s maximum DC voltage divided by cold Voc per module, rounded down to a whole module.
Important: These string lengths are theoretical upper limits based on the stated assumptions. Use the module datasheet’s Voc, temperature coefficient, and voltage tolerance together with the site’s minimum design temperature. Confirm that the string’s operating voltage also stays within the inverter’s MPPT range, and follow applicable electrical codes and inverter instructions.
Conclusion
Choosing Cylindrical Solar PV Modules starts with understanding their geometry and how their curved surfaces interact with light. Do not assume that a cylindrical shape captures sunlight equally from every direction: check the module’s design and test data to verify any 360° light-collection claims. Compare rated output under standard test conditions (STC)—irradiance of 1,000 W/m², an AM1.5 spectrum, and a cell temperature of 25°C—so performance figures are assessed on a consistent basis.
Look beyond headline efficiency by reviewing the temperature coefficient and estimated annual energy yield for the intended installation conditions. Confirm that the module has relevant IEC 61215 performance qualification and IEC 61730 safety compliance, and check that its voltage configuration is compatible with the inverter. In particular, the system’s maximum DC voltage must remain within the inverter’s 1,000 V or 1,500 V limit, as applicable. Considering these factors together supports a practical comparison based on output, durability, safety, and system fit.